Search for Indicators
Demographics Dashboard
The demographic dashboard includes basic demographic information about your community covering topics like population, education and poverty. This dashboard is modeled after the US Census Bureau QuickFacts demographic profile. To learn more about this page, please visit our help center.
Indicator Gauge Icon Legend
Legend Colors
Red is bad, green is good, blue is not statistically different/neutral.
Compared to Distribution
 the value is in the best half of communities.
 the value is in the 2nd worst quarter of communities.
 the value is in the worst quarter of communities.
Compared to Target
 meets target;
  does not meet target.
Compared to a Single Value
 lower than the comparison value;
 higher than the comparison value;
 not statistically different from comparison value.
Trend

 non-significant change over time;
 significant change over time;
  no change over time.
Compared to Prior Value
 higher than the previous measurement period;
 lower than the previous measurement period;
 no statistically different change from previous measurement period.
Income & Poverty
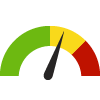
People Living Below Poverty Level Census Tract: 18177000600
People Living Below Poverty Level Census Tract: 18177000600
29.1%
(2018-2022)
Compared to:


IN Census Tracts
The distribution is based on data from 1,684 Indiana census tracts.
U.S. Census Tracts
The distribution is based on data from 82,546 U.S. census tracts.
Wayne, IN County Value
(16.0%)
The regional value is compared to the Wayne County value.
Trend
This comparison measures the indicator’s values over multiple time periods.<br>The Mann-Kendall Test for Statistical Significance is used to evaluate the trend<br>over 4 to 10 periods of measure, subject to data availability and comparability.
HP 2030 Target
(8.0%)
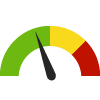
People Living Below Poverty Level Census Tract: 18177000700
People Living Below Poverty Level Census Tract: 18177000700
8.2%
(2018-2022)
Compared to:
IN Census Tracts
The distribution is based on data from 1,684 Indiana census tracts.
U.S. Census Tracts
The distribution is based on data from 82,546 U.S. census tracts.
Wayne, IN County Value
(16.0%)
The regional value is compared to the Wayne County value.
Trend
This comparison measures the indicator’s values over multiple time periods.<br>The Mann-Kendall Test for Statistical Significance is used to evaluate the trend<br>over 4 to 10 periods of measure, subject to data availability and comparability.
HP 2030 Target
(8.0%)
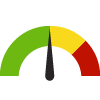
People Living Below Poverty Level Census Tract: 18177000800
People Living Below Poverty Level Census Tract: 18177000800
10.7%
(2018-2022)
Compared to:
IN Census Tracts
The distribution is based on data from 1,684 Indiana census tracts.
U.S. Census Tracts
The distribution is based on data from 82,546 U.S. census tracts.
Wayne, IN County Value
(16.0%)
The regional value is compared to the Wayne County value.
Trend
This comparison measures the indicator’s values over multiple time periods.<br>The Mann-Kendall Test for Statistical Significance is used to evaluate the trend<br>over 4 to 10 periods of measure, subject to data availability and comparability.
HP 2030 Target
(8.0%)
People Living Below Poverty Level Census Tract: 18177000900
People Living Below Poverty Level Census Tract: 18177000900
23.5%
(2018-2022)
Compared to:
IN Census Tracts
The distribution is based on data from 1,684 Indiana census tracts.
U.S. Census Tracts
The distribution is based on data from 82,546 U.S. census tracts.
Wayne, IN County Value
(16.0%)
The regional value is compared to the Wayne County value.
Trend
This comparison measures the indicator’s values over multiple time periods.<br>The Mann-Kendall Test for Statistical Significance is used to evaluate the trend<br>over 4 to 10 periods of measure, subject to data availability and comparability.
HP 2030 Target
(8.0%)
People Living Below Poverty Level Census Tract: 18177001000
People Living Below Poverty Level Census Tract: 18177001000
23.9%
(2018-2022)
Compared to:
IN Census Tracts
The distribution is based on data from 1,684 Indiana census tracts.
U.S. Census Tracts
The distribution is based on data from 82,546 U.S. census tracts.
Wayne, IN County Value
(16.0%)
The regional value is compared to the Wayne County value.
Trend
This comparison measures the indicator’s values over multiple time periods.<br>The Mann-Kendall Test for Statistical Significance is used to evaluate the trend<br>over 4 to 10 periods of measure, subject to data availability and comparability.
HP 2030 Target
(8.0%)
People Living Below Poverty Level Census Tract: 18177001100
People Living Below Poverty Level Census Tract: 18177001100
10.6%
(2015-2019)
Compared to:
IN Census Tracts
The distribution is based on data from 1,505 Indiana census tracts.
U.S. Census Tracts
The distribution is based on data from 72,257 U.S. census tracts.
Wayne, IN County Value
(16.4%)
The regional value is compared to the Wayne County value.
Trend
This comparison measures the indicator’s values over multiple time periods.<br>The Mann-Kendall Test for Statistical Significance is used to evaluate the trend<br>over 4 to 10 periods of measure, subject to data availability and comparability.
HP 2030 Target
(8.0%)
People Living Below Poverty Level Census Tract: 18177001101
People Living Below Poverty Level Census Tract: 18177001101
6.8%
(2018-2022)
Compared to:
IN Census Tracts
The distribution is based on data from 1,684 Indiana census tracts.
U.S. Census Tracts
The distribution is based on data from 82,546 U.S. census tracts.
Wayne, IN County Value
(16.0%)
The regional value is compared to the Wayne County value.
HP 2030 Target
(8.0%)
People Living Below Poverty Level Census Tract: 18177001102
People Living Below Poverty Level Census Tract: 18177001102
2.9%
(2018-2022)
Compared to:

IN Census Tracts
The distribution is based on data from 1,684 Indiana census tracts.
U.S. Census Tracts
The distribution is based on data from 82,546 U.S. census tracts.
Wayne, IN County Value
(16.0%)
The regional value is compared to the Wayne County value.
HP 2030 Target
(8.0%)
People Living Below Poverty Level Census Tract: 18177010100
People Living Below Poverty Level Census Tract: 18177010100
5.0%
(2018-2022)
Compared to:
IN Census Tracts
The distribution is based on data from 1,684 Indiana census tracts.
U.S. Census Tracts
The distribution is based on data from 82,546 U.S. census tracts.
Wayne, IN County Value
(16.0%)
The regional value is compared to the Wayne County value.
Trend
This comparison measures the indicator’s values over multiple time periods.<br>The Mann-Kendall Test for Statistical Significance is used to evaluate the trend<br>over 4 to 10 periods of measure, subject to data availability and comparability.
HP 2030 Target
(8.0%)
People Living Below Poverty Level Census Tract: 18177010200
People Living Below Poverty Level Census Tract: 18177010200
8.6%
(2018-2022)
Compared to:
IN Census Tracts
The distribution is based on data from 1,684 Indiana census tracts.
U.S. Census Tracts
The distribution is based on data from 82,546 U.S. census tracts.
Wayne, IN County Value
(16.0%)
The regional value is compared to the Wayne County value.
Trend
This comparison measures the indicator’s values over multiple time periods.<br>The Mann-Kendall Test for Statistical Significance is used to evaluate the trend<br>over 4 to 10 periods of measure, subject to data availability and comparability.
HP 2030 Target
(8.0%)
People Living Below Poverty Level Census Tract: 18177010300
People Living Below Poverty Level Census Tract: 18177010300
7.7%
(2018-2022)
Compared to:
IN Census Tracts
The distribution is based on data from 1,684 Indiana census tracts.
U.S. Census Tracts
The distribution is based on data from 82,546 U.S. census tracts.
Wayne, IN County Value
(16.0%)
The regional value is compared to the Wayne County value.
Trend
This comparison measures the indicator’s values over multiple time periods.<br>The Mann-Kendall Test for Statistical Significance is used to evaluate the trend<br>over 4 to 10 periods of measure, subject to data availability and comparability.
HP 2030 Target
(8.0%)
People Living Below Poverty Level Census Tract: 18177010400
People Living Below Poverty Level Census Tract: 18177010400
10.5%
(2018-2022)
Compared to:
IN Census Tracts
The distribution is based on data from 1,684 Indiana census tracts.
U.S. Census Tracts
The distribution is based on data from 82,546 U.S. census tracts.
Wayne, IN County Value
(16.0%)
The regional value is compared to the Wayne County value.
Trend
This comparison measures the indicator’s values over multiple time periods.<br>The Mann-Kendall Test for Statistical Significance is used to evaluate the trend<br>over 4 to 10 periods of measure, subject to data availability and comparability.
HP 2030 Target
(8.0%)
People Living Below Poverty Level Census Tract: 18177010500
People Living Below Poverty Level Census Tract: 18177010500
5.8%
(2018-2022)
Compared to:
IN Census Tracts
The distribution is based on data from 1,684 Indiana census tracts.
U.S. Census Tracts
The distribution is based on data from 82,546 U.S. census tracts.
Wayne, IN County Value
(16.0%)
The regional value is compared to the Wayne County value.
Trend
This comparison measures the indicator’s values over multiple time periods.<br>The Mann-Kendall Test for Statistical Significance is used to evaluate the trend<br>over 4 to 10 periods of measure, subject to data availability and comparability.
HP 2030 Target
(8.0%)
People Living Below Poverty Level Census Tract: 18177010600
People Living Below Poverty Level Census Tract: 18177010600
17.1%
(2018-2022)
Compared to:

IN Census Tracts
The distribution is based on data from 1,684 Indiana census tracts.
U.S. Census Tracts
The distribution is based on data from 82,546 U.S. census tracts.
Wayne, IN County Value
(16.0%)
The regional value is compared to the Wayne County value.
Trend
This comparison measures the indicator’s values over multiple time periods.<br>The Mann-Kendall Test for Statistical Significance is used to evaluate the trend<br>over 4 to 10 periods of measure, subject to data availability and comparability.
HP 2030 Target
(8.0%)
People Living Below Poverty Level Census Tract: 18177010700
People Living Below Poverty Level Census Tract: 18177010700
9.7%
(2018-2022)
Compared to:
IN Census Tracts
The distribution is based on data from 1,684 Indiana census tracts.
U.S. Census Tracts
The distribution is based on data from 82,546 U.S. census tracts.
Wayne, IN County Value
(16.0%)
The regional value is compared to the Wayne County value.
Trend
This comparison measures the indicator’s values over multiple time periods.<br>The Mann-Kendall Test for Statistical Significance is used to evaluate the trend<br>over 4 to 10 periods of measure, subject to data availability and comparability.
HP 2030 Target
(8.0%)
People Living Below Poverty Level Census Tract: 18177010800
People Living Below Poverty Level Census Tract: 18177010800
13.9%
(2018-2022)
Compared to:
IN Census Tracts
The distribution is based on data from 1,684 Indiana census tracts.
U.S. Census Tracts
The distribution is based on data from 82,546 U.S. census tracts.
Wayne, IN County Value
(16.0%)
The regional value is compared to the Wayne County value.
Trend
This comparison measures the indicator’s values over multiple time periods.<br>The Mann-Kendall Test for Statistical Significance is used to evaluate the trend<br>over 4 to 10 periods of measure, subject to data availability and comparability.
HP 2030 Target
(8.0%)
People Living Below Poverty Level Census Tract: 39037500100
People Living Below Poverty Level Census Tract: 39037500100
10.3%
(2018-2022)
Compared to:
OH Census Tracts
The distribution is based on data from 3,152 Ohio census tracts.
U.S. Census Tracts
The distribution is based on data from 82,546 U.S. census tracts.
Darke, OH County Value
(11.0%)
The regional value is compared to the Darke County value.
Trend
This comparison measures the indicator’s values over multiple time periods.<br>The Mann-Kendall Test for Statistical Significance is used to evaluate the trend<br>over 4 to 10 periods of measure, subject to data availability and comparability.
HP 2030 Target
(8.0%)
People Living Below Poverty Level Census Tract: 39037510100
People Living Below Poverty Level Census Tract: 39037510100
23.3%
(2018-2022)
Compared to:


OH Census Tracts
The distribution is based on data from 3,152 Ohio census tracts.
U.S. Census Tracts
The distribution is based on data from 82,546 U.S. census tracts.
Darke, OH County Value
(11.0%)
The regional value is compared to the Darke County value.
Trend
This comparison measures the indicator’s values over multiple time periods.<br>The Mann-Kendall Test for Statistical Significance is used to evaluate the trend<br>over 4 to 10 periods of measure, subject to data availability and comparability.
HP 2030 Target
(8.0%)
People Living Below Poverty Level Census Tract: 39037520100
People Living Below Poverty Level Census Tract: 39037520100
11.0%
(2018-2022)
Compared to:
OH Census Tracts
The distribution is based on data from 3,152 Ohio census tracts.
U.S. Census Tracts
The distribution is based on data from 82,546 U.S. census tracts.
Darke, OH County Value
(11.0%)
The regional value is compared to the Darke County value.
Trend
This comparison measures the indicator’s values over multiple time periods.<br>The Mann-Kendall Test for Statistical Significance is used to evaluate the trend<br>over 4 to 10 periods of measure, subject to data availability and comparability.
HP 2030 Target
(8.0%)
People Living Below Poverty Level Census Tract: 39037530100
People Living Below Poverty Level Census Tract: 39037530100
4.5%
(2018-2022)
Compared to:
OH Census Tracts
The distribution is based on data from 3,152 Ohio census tracts.
U.S. Census Tracts
The distribution is based on data from 82,546 U.S. census tracts.
Darke, OH County Value
(11.0%)
The regional value is compared to the Darke County value.
Trend
This comparison measures the indicator’s values over multiple time periods.<br>The Mann-Kendall Test for Statistical Significance is used to evaluate the trend<br>over 4 to 10 periods of measure, subject to data availability and comparability.
HP 2030 Target
(8.0%)
People Living Below Poverty Level Census Tract: 39037540100
People Living Below Poverty Level Census Tract: 39037540100
8.0%
(2018-2022)
Compared to:
OH Census Tracts
The distribution is based on data from 3,152 Ohio census tracts.
U.S. Census Tracts
The distribution is based on data from 82,546 U.S. census tracts.
Darke, OH County Value
(11.0%)
The regional value is compared to the Darke County value.
Trend
This comparison measures the indicator’s values over multiple time periods.<br>The Mann-Kendall Test for Statistical Significance is used to evaluate the trend<br>over 4 to 10 periods of measure, subject to data availability and comparability.
HP 2030 Target
(8.0%)
People Living Below Poverty Level Census Tract: 39037550100
People Living Below Poverty Level Census Tract: 39037550100
6.4%
(2018-2022)
Compared to:
OH Census Tracts
The distribution is based on data from 3,152 Ohio census tracts.
U.S. Census Tracts
The distribution is based on data from 82,546 U.S. census tracts.
Darke, OH County Value
(11.0%)
The regional value is compared to the Darke County value.
Trend
This comparison measures the indicator’s values over multiple time periods.<br>The Mann-Kendall Test for Statistical Significance is used to evaluate the trend<br>over 4 to 10 periods of measure, subject to data availability and comparability.
HP 2030 Target
(8.0%)
People Living Below Poverty Level Census Tract: 39037555000
People Living Below Poverty Level Census Tract: 39037555000
10.0%
(2015-2019)
Compared to:
OH Census Tracts
The distribution is based on data from 2,938 Ohio census tracts.
U.S. Census Tracts
The distribution is based on data from 72,257 U.S. census tracts.
Darke, OH County Value
(10.5%)
The regional value is compared to the Darke County value.
Trend
This comparison measures the indicator’s values over multiple time periods.<br>The Mann-Kendall Test for Statistical Significance is used to evaluate the trend<br>over 4 to 10 periods of measure, subject to data availability and comparability.
HP 2030 Target
(8.0%)
People Living Below Poverty Level Census Tract: 39037555001
People Living Below Poverty Level Census Tract: 39037555001
6.4%
(2018-2022)
Compared to:
OH Census Tracts
The distribution is based on data from 3,152 Ohio census tracts.
U.S. Census Tracts
The distribution is based on data from 82,546 U.S. census tracts.
Darke, OH County Value
(11.0%)
The regional value is compared to the Darke County value.
HP 2030 Target
(8.0%)
People Living Below Poverty Level Census Tract: 39037555002
People Living Below Poverty Level Census Tract: 39037555002
9.5%
(2018-2022)
Compared to:
OH Census Tracts
The distribution is based on data from 3,152 Ohio census tracts.
U.S. Census Tracts
The distribution is based on data from 82,546 U.S. census tracts.
Darke, OH County Value
(11.0%)
The regional value is compared to the Darke County value.
HP 2030 Target
(8.0%)
People Living Below Poverty Level Census Tract: 39037555101
People Living Below Poverty Level Census Tract: 39037555101
16.0%
(2018-2022)
Compared to:
OH Census Tracts
The distribution is based on data from 3,152 Ohio census tracts.
U.S. Census Tracts
The distribution is based on data from 82,546 U.S. census tracts.
Darke, OH County Value
(11.0%)
The regional value is compared to the Darke County value.
Trend
This comparison measures the indicator’s values over multiple time periods.<br>The Mann-Kendall Test for Statistical Significance is used to evaluate the trend<br>over 4 to 10 periods of measure, subject to data availability and comparability.
HP 2030 Target
(8.0%)
People Living Below Poverty Level Census Tract: 39037555102
People Living Below Poverty Level Census Tract: 39037555102
19.2%
(2018-2022)
Compared to:
OH Census Tracts
The distribution is based on data from 3,152 Ohio census tracts.
U.S. Census Tracts
The distribution is based on data from 82,546 U.S. census tracts.
Darke, OH County Value
(11.0%)
The regional value is compared to the Darke County value.
Trend
This comparison measures the indicator’s values over multiple time periods.<br>The Mann-Kendall Test for Statistical Significance is used to evaluate the trend<br>over 4 to 10 periods of measure, subject to data availability and comparability.
HP 2030 Target
(8.0%)
People Living Below Poverty Level Census Tract: 39037560100
People Living Below Poverty Level Census Tract: 39037560100
8.6%
(2015-2019)
Compared to:
OH Census Tracts
The distribution is based on data from 2,938 Ohio census tracts.
U.S. Census Tracts
The distribution is based on data from 72,257 U.S. census tracts.
Darke, OH County Value
(10.5%)
The regional value is compared to the Darke County value.
Trend
This comparison measures the indicator’s values over multiple time periods.<br>The Mann-Kendall Test for Statistical Significance is used to evaluate the trend<br>over 4 to 10 periods of measure, subject to data availability and comparability.
HP 2030 Target
(8.0%)
People Living Below Poverty Level Census Tract: 39037560101
People Living Below Poverty Level Census Tract: 39037560101
7.4%
(2018-2022)
Compared to:
OH Census Tracts
The distribution is based on data from 3,152 Ohio census tracts.
U.S. Census Tracts
The distribution is based on data from 82,546 U.S. census tracts.
Darke, OH County Value
(11.0%)
The regional value is compared to the Darke County value.
HP 2030 Target
(8.0%)
People Living Below Poverty Level Census Tract: 39037560102
People Living Below Poverty Level Census Tract: 39037560102
13.5%
(2018-2022)
Compared to:
OH Census Tracts
The distribution is based on data from 3,152 Ohio census tracts.
U.S. Census Tracts
The distribution is based on data from 82,546 U.S. census tracts.
Darke, OH County Value
(11.0%)
The regional value is compared to the Darke County value.
HP 2030 Target
(8.0%)
People Living Below Poverty Level Census Tract: 39037570101
People Living Below Poverty Level Census Tract: 39037570101
8.9%
(2018-2022)
Compared to:
OH Census Tracts
The distribution is based on data from 3,152 Ohio census tracts.
U.S. Census Tracts
The distribution is based on data from 82,546 U.S. census tracts.
Darke, OH County Value
(11.0%)
The regional value is compared to the Darke County value.
Trend
This comparison measures the indicator’s values over multiple time periods.<br>The Mann-Kendall Test for Statistical Significance is used to evaluate the trend<br>over 4 to 10 periods of measure, subject to data availability and comparability.
HP 2030 Target
(8.0%)
People Living Below Poverty Level Census Tract: 39037570102
People Living Below Poverty Level Census Tract: 39037570102
9.6%
(2018-2022)
Compared to:
OH Census Tracts
The distribution is based on data from 3,152 Ohio census tracts.
U.S. Census Tracts
The distribution is based on data from 82,546 U.S. census tracts.
Darke, OH County Value
(11.0%)
The regional value is compared to the Darke County value.
Trend
This comparison measures the indicator’s values over multiple time periods.<br>The Mann-Kendall Test for Statistical Significance is used to evaluate the trend<br>over 4 to 10 periods of measure, subject to data availability and comparability.
HP 2030 Target
(8.0%)
People Living Below Poverty Level Census Tract: 39135400100
People Living Below Poverty Level Census Tract: 39135400100
16.7%
(2018-2022)
Compared to:
OH Census Tracts
The distribution is based on data from 3,152 Ohio census tracts.
U.S. Census Tracts
The distribution is based on data from 82,546 U.S. census tracts.
Preble, OH County Value
(10.3%)
The regional value is compared to the Preble County value.
Trend
This comparison measures the indicator’s values over multiple time periods.<br>The Mann-Kendall Test for Statistical Significance is used to evaluate the trend<br>over 4 to 10 periods of measure, subject to data availability and comparability.
HP 2030 Target
(8.0%)
People Living Below Poverty Level Census Tract: 39135410100
People Living Below Poverty Level Census Tract: 39135410100
12.4%
(2018-2022)
Compared to:
OH Census Tracts
The distribution is based on data from 3,152 Ohio census tracts.
U.S. Census Tracts
The distribution is based on data from 82,546 U.S. census tracts.
Preble, OH County Value
(10.3%)
The regional value is compared to the Preble County value.
Trend
This comparison measures the indicator’s values over multiple time periods.<br>The Mann-Kendall Test for Statistical Significance is used to evaluate the trend<br>over 4 to 10 periods of measure, subject to data availability and comparability.
HP 2030 Target
(8.0%)
People Living Below Poverty Level Census Tract: 39135420100
People Living Below Poverty Level Census Tract: 39135420100
9.5%
(2018-2022)
Compared to:
OH Census Tracts
The distribution is based on data from 3,152 Ohio census tracts.
U.S. Census Tracts
The distribution is based on data from 82,546 U.S. census tracts.
Preble, OH County Value
(10.3%)
The regional value is compared to the Preble County value.
Trend
This comparison measures the indicator’s values over multiple time periods.<br>The Mann-Kendall Test for Statistical Significance is used to evaluate the trend<br>over 4 to 10 periods of measure, subject to data availability and comparability.
HP 2030 Target
(8.0%)
People Living Below Poverty Level Census Tract: 39135430100
People Living Below Poverty Level Census Tract: 39135430100
13.5%
(2018-2022)
Compared to:
OH Census Tracts
The distribution is based on data from 3,152 Ohio census tracts.
U.S. Census Tracts
The distribution is based on data from 82,546 U.S. census tracts.
Preble, OH County Value
(10.3%)
The regional value is compared to the Preble County value.
Trend
This comparison measures the indicator’s values over multiple time periods.<br>The Mann-Kendall Test for Statistical Significance is used to evaluate the trend<br>over 4 to 10 periods of measure, subject to data availability and comparability.
HP 2030 Target
(8.0%)
People Living Below Poverty Level Census Tract: 39135440100
People Living Below Poverty Level Census Tract: 39135440100
6.5%
(2018-2022)
Compared to:
OH Census Tracts
The distribution is based on data from 3,152 Ohio census tracts.
U.S. Census Tracts
The distribution is based on data from 82,546 U.S. census tracts.
Preble, OH County Value
(10.3%)
The regional value is compared to the Preble County value.
Trend
This comparison measures the indicator’s values over multiple time periods.<br>The Mann-Kendall Test for Statistical Significance is used to evaluate the trend<br>over 4 to 10 periods of measure, subject to data availability and comparability.
HP 2030 Target
(8.0%)
People Living Below Poverty Level Census Tract: 39135450100
People Living Below Poverty Level Census Tract: 39135450100
13.7%
(2018-2022)
Compared to:
OH Census Tracts
The distribution is based on data from 3,152 Ohio census tracts.
U.S. Census Tracts
The distribution is based on data from 82,546 U.S. census tracts.
Preble, OH County Value
(10.3%)
The regional value is compared to the Preble County value.
Trend
This comparison measures the indicator’s values over multiple time periods.<br>The Mann-Kendall Test for Statistical Significance is used to evaluate the trend<br>over 4 to 10 periods of measure, subject to data availability and comparability.
HP 2030 Target
(8.0%)
People Living Below Poverty Level Census Tract: 39135455001
People Living Below Poverty Level Census Tract: 39135455001
8.2%
(2018-2022)
Compared to:
OH Census Tracts
The distribution is based on data from 3,152 Ohio census tracts.
U.S. Census Tracts
The distribution is based on data from 82,546 U.S. census tracts.
Preble, OH County Value
(10.3%)
The regional value is compared to the Preble County value.
Trend
This comparison measures the indicator’s values over multiple time periods.<br>The Mann-Kendall Test for Statistical Significance is used to evaluate the trend<br>over 4 to 10 periods of measure, subject to data availability and comparability.
HP 2030 Target
(8.0%)
People Living Below Poverty Level Census Tract: 39135455002
People Living Below Poverty Level Census Tract: 39135455002
10.7%
(2018-2022)
Compared to:
OH Census Tracts
The distribution is based on data from 3,152 Ohio census tracts.
U.S. Census Tracts
The distribution is based on data from 82,546 U.S. census tracts.
Preble, OH County Value
(10.3%)
The regional value is compared to the Preble County value.
Trend
This comparison measures the indicator’s values over multiple time periods.<br>The Mann-Kendall Test for Statistical Significance is used to evaluate the trend<br>over 4 to 10 periods of measure, subject to data availability and comparability.
HP 2030 Target
(8.0%)
People Living Below Poverty Level Census Tract: 39135460100
People Living Below Poverty Level Census Tract: 39135460100
12.3%
(2018-2022)
Compared to:
OH Census Tracts
The distribution is based on data from 3,152 Ohio census tracts.
U.S. Census Tracts
The distribution is based on data from 82,546 U.S. census tracts.
Preble, OH County Value
(10.3%)
The regional value is compared to the Preble County value.
Trend
This comparison measures the indicator’s values over multiple time periods.<br>The Mann-Kendall Test for Statistical Significance is used to evaluate the trend<br>over 4 to 10 periods of measure, subject to data availability and comparability.
HP 2030 Target
(8.0%)
People Living Below Poverty Level Census Tract: 39135470101
People Living Below Poverty Level Census Tract: 39135470101
3.8%
(2018-2022)
Compared to:
OH Census Tracts
The distribution is based on data from 3,152 Ohio census tracts.
U.S. Census Tracts
The distribution is based on data from 82,546 U.S. census tracts.
Preble, OH County Value
(10.3%)
The regional value is compared to the Preble County value.
Trend
This comparison measures the indicator’s values over multiple time periods.<br>The Mann-Kendall Test for Statistical Significance is used to evaluate the trend<br>over 4 to 10 periods of measure, subject to data availability and comparability.
HP 2030 Target
(8.0%)
People Living Below Poverty Level Census Tract: 39135470102
People Living Below Poverty Level Census Tract: 39135470102
15.1%
(2018-2022)
Compared to:
OH Census Tracts
The distribution is based on data from 3,152 Ohio census tracts.
U.S. Census Tracts
The distribution is based on data from 82,546 U.S. census tracts.
Preble, OH County Value
(10.3%)
The regional value is compared to the Preble County value.
Trend
This comparison measures the indicator’s values over multiple time periods.<br>The Mann-Kendall Test for Statistical Significance is used to evaluate the trend<br>over 4 to 10 periods of measure, subject to data availability and comparability.
HP 2030 Target
(8.0%)
People Living Below Poverty Level Census Tract: 39135480100
People Living Below Poverty Level Census Tract: 39135480100
4.9%
(2018-2022)
Compared to:
OH Census Tracts
The distribution is based on data from 3,152 Ohio census tracts.
U.S. Census Tracts
The distribution is based on data from 82,546 U.S. census tracts.
Preble, OH County Value
(10.3%)
The regional value is compared to the Preble County value.
Trend
This comparison measures the indicator’s values over multiple time periods.<br>The Mann-Kendall Test for Statistical Significance is used to evaluate the trend<br>over 4 to 10 periods of measure, subject to data availability and comparability.
HP 2030 Target
(8.0%)
Businesses
Employer Establishments County: Darke, OH
Employer Establishments County: Darke, OH
1,138
Number of Establishments
(2021)
Compared to:


Prior Value
(1,136)
Prior Value compares a measured value with the previously measured value. Confidence intervals were not taken into account in determining the direction of the comparison.
Trend
This comparison measures the indicator’s values over multiple time periods.<br>The Mann-Kendall Test for Statistical Significance is used to evaluate the trend<br>over 4 to 10 periods of measure, subject to data availability and comparability.
Employer Establishments County: Fayette, IN
Employer Establishments County: Fayette, IN
404
Number of Establishments
(2021)
Compared to:

Prior Value
(398)
Prior Value compares a measured value with the previously measured value. Confidence intervals were not taken into account in determining the direction of the comparison.
Trend
This comparison measures the indicator’s values over multiple time periods.<br>The Mann-Kendall Test for Statistical Significance is used to evaluate the trend<br>over 4 to 10 periods of measure, subject to data availability and comparability.
Employer Establishments County: Franklin, IN
Employer Establishments County: Franklin, IN
438
Number of Establishments
(2021)
Compared to:

Prior Value
(431)
Prior Value compares a measured value with the previously measured value. Confidence intervals were not taken into account in determining the direction of the comparison.
Trend
This comparison measures the indicator’s values over multiple time periods.<br>The Mann-Kendall Test for Statistical Significance is used to evaluate the trend<br>over 4 to 10 periods of measure, subject to data availability and comparability.
Employer Establishments County: Henry, IN
Employer Establishments County: Henry, IN
846
Number of Establishments
(2021)
Compared to:

Prior Value
(833)
Prior Value compares a measured value with the previously measured value. Confidence intervals were not taken into account in determining the direction of the comparison.
Trend
This comparison measures the indicator’s values over multiple time periods.<br>The Mann-Kendall Test for Statistical Significance is used to evaluate the trend<br>over 4 to 10 periods of measure, subject to data availability and comparability.
Employer Establishments County: Preble, OH
Employer Establishments County: Preble, OH
661
Number of Establishments
(2021)
Compared to:

Prior Value
(664)
Prior Value compares a measured value with the previously measured value. Confidence intervals were not taken into account in determining the direction of the comparison.
Trend
This comparison measures the indicator’s values over multiple time periods.<br>The Mann-Kendall Test for Statistical Significance is used to evaluate the trend<br>over 4 to 10 periods of measure, subject to data availability and comparability.
Employer Establishments County: Randolph, IN
Employer Establishments County: Randolph, IN
479
Number of Establishments
(2021)
Compared to:
Prior Value
(466)
Prior Value compares a measured value with the previously measured value. Confidence intervals were not taken into account in determining the direction of the comparison.
Trend
This comparison measures the indicator’s values over multiple time periods.<br>The Mann-Kendall Test for Statistical Significance is used to evaluate the trend<br>over 4 to 10 periods of measure, subject to data availability and comparability.
Employer Establishments County: Union, IN
Employer Establishments County: Union, IN
118
Number of Establishments
(2021)
Compared to:
Prior Value
(119)
Prior Value compares a measured value with the previously measured value. Confidence intervals were not taken into account in determining the direction of the comparison.
Trend
This comparison measures the indicator’s values over multiple time periods.<br>The Mann-Kendall Test for Statistical Significance is used to evaluate the trend<br>over 4 to 10 periods of measure, subject to data availability and comparability.
Employer Establishments County: Wayne, IN
Employer Establishments County: Wayne, IN
1,426
Number of Establishments
(2021)
Compared to:
Prior Value
(1,430)
Prior Value compares a measured value with the previously measured value. Confidence intervals were not taken into account in determining the direction of the comparison.
Trend
This comparison measures the indicator’s values over multiple time periods.<br>The Mann-Kendall Test for Statistical Significance is used to evaluate the trend<br>over 4 to 10 periods of measure, subject to data availability and comparability.
